Introduction: The Illusion of Security
Walk into most industrial facilities across India, a manufacturing plant in Pune, a petrochemical complex in Gujarat, a logistics hub in Chennai and you will see cameras everywhere. Mounted on poles, fixed to walls, scanning every corner. The security manager points proudly at the monitor room: ‘We have 200 cameras. We have complete coverage.’
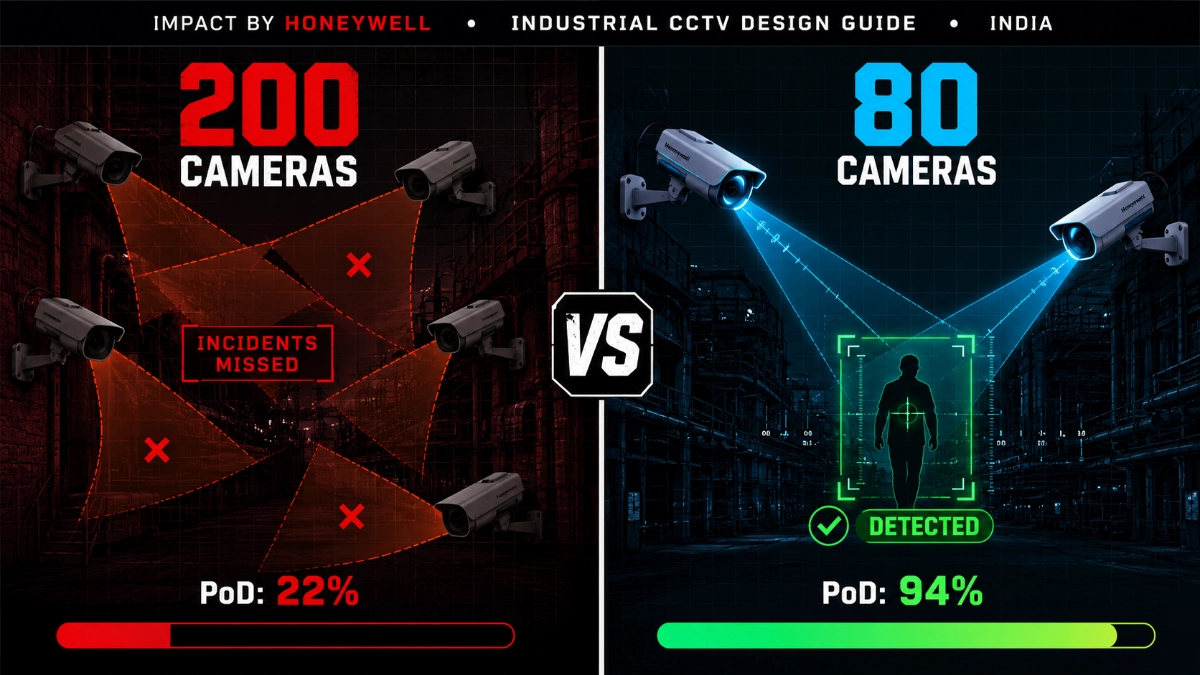
But here is the uncomfortable truth: complete coverage and effective detection are not the same thing.
| A surveillance system with 200 poorly placed cameras can miss more incidents than a well-designed system with 80 cameras. The difference is not the count; it is the science behind each camera’s placement, field of view, pixel density, and analytical capability. |
This article explains why Probability of Detection (PoD) is the metric that actually matters in CCTV system design and how Indian security professionals, system integrators and enterprise buyers can use it to build surveillance systems that genuinely prevent incidents, not just document them after the fact.
| SECTION 1: Understanding Probability of Detection (PoD) |
What is the Probability of Detection in CCTV Systems?
Probability of Detection (PoD) measures the statistical likelihood that a surveillance system will detect a specific incident within a defined area, under real-world operating conditions. It is expressed as a percentage from 0% (the system will never detect the event) to 100% (the system will always detect the event).
PoD is not a simple on/off measure. It accounts for multiple variables working together:
- Camera resolution and pixel density at the point of interest.
- Field of view and angle relative to the target zone.
- Lighting conditions at different times of day and night.
- Human operator attention span and response latency.
- Scene complexity and potential occlusion (objects blocking the view).
- AI analytics capability to flag anomalies autonomously.
- Camera frame rate and motion sensitivity settings.
When security engineers at a certified distribution partner like Impact by Honeywell design a surveillance system, they work backwards from the required PoD. They ask: What level of detection confidence does this facility need, and what camera configuration achieves that?
PoD vs Detection Rate: Know the Difference
Many professionals confuse PoD with the detection rate. Detection rate refers to how many incidents the system actually logged over a period. PoD is the theoretical probability that the system is capable of detecting an incident, regardless of whether one occurred.
| Metric | Definition | Example Value | Use Case |
| Probability of Detection (PoD) | System’s theoretical detection capability | 85% PoD for perimeter intrusion | System design & validation |
| Detection Rate | Incidents detected / Total incidents | 72% over 6 months | Post-deployment audit |
| False Positive Rate | False alarms / Total alerts | 3% false trigger rate | Analytics tuning |
| Mean Time to Detect (MTTD) | Avg. time from incident start to alert | < 8 seconds | Response SLA design |
| SECTION 2: Camera Coverage vs Actionable Surveillance Data |
Camera Coverage vs Actionable Surveillance Data
Camera coverage refers to the physical area that appears within a camera’s field of view. Actionable surveillance data refers to information the system can actually use to detect, alert, and respond to incidents in real time.
You can have 100% camera coverage of a facility and still have near-zero actionable surveillance data if:
- Cameras are mounted too high, making face identification impossible.
- Wide-angle lenses create distortion that defeats AI analytics.
- Pixel density is too low to distinguish a person from a shadow.
- Lighting is insufficient for the camera sensor type installed.
- No analytics engine processes the video; only passive recording.
- Operators are watching too many screens simultaneously.
| A study of industrial security failures consistently shows that most incidents occurred within camera fields of view but were missed because the data quality was too poor for detection, or because no one was watching at the time of the event. |
Why Wide Coverage Can Still Miss Critical Incidents
Wide-angle cameras seem attractive. One camera covers more ground. But physics and optics impose strict limits on what that coverage actually delivers.
Consider a 180-degree fisheye camera mounted at 8 metres height covering a factory floor. The total coverage area might be 500 square metres. But in that wide view:
- A person at 25 metres from the camera occupies fewer than 5 pixels per metre, far below the 25 PPM threshold required for identification.
- The edges of the frame suffer barrel distortion, defeating motion detection algorithms.
- A vehicle partially blocking another area creates a persistent blind spot within the ‘covered’ zone.
- At night, the sensor struggles to maintain consistent exposure across the entire wide field.
This is why professional CCTV design engineers, whether working directly or through qualified partners like Impact by Honeywell, a CCTV distributor in India, break large areas into multiple targeted camera zones, each optimised for its specific detection function.
| SECTION 3: DORI Standards & Pixel Density |
DORI Standards: The Engineering Foundation of Detection Design
The DORI standard (Detection, Observation, Recognition, Identification) is the international benchmark for measuring camera performance at specific distances. Every professional CCTV design must be anchored to DORI requirements.
| DORI Level | Pixel Density Required | Capability | Typical Use Case in India |
| Detection | 25 PPM (pixels per metre) | Detect presence of a person or vehicle | Perimeter fencing, wide open areas, parking lots |
| Observation | 62 PPM | Observe behaviour, posture, movement direction | Entry corridors, factory floors, loading docks |
| Recognition | 125 PPM | Recognise a known individual by facial features | Access gates, reception counters, cashier areas |
| Identification | 250 PPM | Legally admissible identification of an individual | Server rooms, vault entrances, ATM surveillance |
Failing to design to DORI standards is the single most common reason Indian surveillance deployments fail forensic investigations. A camera that detects a figure but cannot identify it becomes legally useless in criminal proceedings.
| Critical Insight: Before finalising any camera model, calculate the required distance from the camera to the detection zone, apply the DORI formula, and verify the camera’s sensor resolution can deliver the required PPM at that distance. Never assume coverage from a camera’s listed megapixel rating alone. |
| SECTION 4: Detection Probability in Industrial Environments |
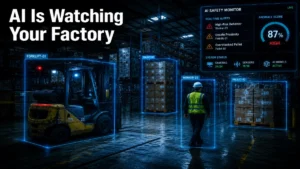
Detection Probability in Industrial Environments
Industrial surveillance presents challenges that commercial environments rarely face. Any security engineer designing CCTV for Indian manufacturing, energy, logistics, or infrastructure projects must address:
1. Environmental Interference
- Dust, smoke, and steam reduce visibility and confuse optical sensors.
- Vibration from heavy machinery causes camera shake, increasing false positives.
- Temperature extremes affect both camera hardware and image quality.
- Chemical environments corrode standard camera housings within months.
2. Scene Complexity
- High-density storage racks, machinery, and conveyors create layered blind spots.
- Worker uniforms in similar colours reduce person-detection contrast.
- Frequent legitimate movement patterns make behavioural anomaly detection harder to calibrate.
- Shift changes create crowd scenarios that overwhelm basic motion detection.
3. Lighting Variability
- Industrial facilities often have dramatic lighting transitions across shifts.
- Outdoor perimeters shift from daylight to artificial lighting to complete darkness.
- Reflective surfaces from metal equipment create overexposure zones.
- Emergency lighting during power failures must be considered in camera selection.
| Real-World Example: The Costly Blind Spot: A large automotive component plant in Maharashtra installed 140 cameras across its production floor. Despite ‘complete coverage,’ the facility experienced repeated theft of high-value components from the raw materials store. Investigation revealed that the camera covering the store entrance was mounted at a height of 6 metres with a 90-degree wide lens. The DORI calculation showed the camera achieved only 18 PPM at the critical 4-metre zone below even the detection level. Personnel were visible as blobs, not identifiable individuals. Redeployment of a 2-megapixel varifocal camera at 3 metres height achieved 210 PPM at that zone, sufficient for Identification, and the thefts stopped within one month. |
This is the core of the PoD argument. The original system had coverage. It did not have a detection probability.
| SECTION 5: Blind Spots & Human Behaviour Patterns |
Blind Spots, Human Behaviour, and the Physics of Surveillance
Every camera creates a frustum, a three-dimensional cone of vision. Anything outside that cone is a blind spot. In complex environments, blind spots overlap and stack. A thorough CCTV design must map all blind spots and either eliminate them with additional cameras or accept them as calculated risk zones with compensating controls.
Common Sources of Blind Spots in Indian Industrial Facilities
- Pillars and structural columns among the most overlooked obstruction sources.
- Ceiling-mounted equipment: ventilation ducts, overhead cranes, material handling systems.
- Parked vehicles and temporary storage that change the scene layout regularly.
- Adjacent camera zones that overlap insufficiently, creating a gap at the boundary.
- Camera tilt angles that create a ‘dead zone’ directly beneath the mounting point.
Human Behaviour Patterns That Defeat Camera Coverage
Security professionals must design for adversarial human behaviour, not just random incidents. Experienced intruders, disgruntled employees, and opportunistic thieves study camera positions. They exploit:
- Camera rotation pauses in PTZ systems the moment a pan-tilt camera changes direction.
- Lighting transition zones where a person moving from bright to dark areas temporarily disappears from optical sensors.
- Crowd events where individual tracking becomes impossible.
- Predictable operator attention patterns during shift changes and mealtimes.
| Key Principle: Design for the motivated adversary, not the accidental intruder. A surveillance system that only detects clumsy, uninformed threats delivers false confidence to security managers. |
| SECTION 6: How AI Changes Modern CCTV Performance |
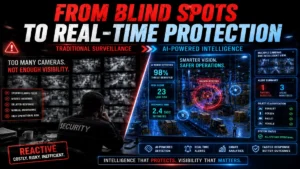
How AI Changes Modern CCTV Performance
Artificial intelligence video analytics represents the most significant advancement in surveillance technology since the transition from analogue to IP cameras. AI does not just record, it understands.
What AI-Powered Video Analytics Delivers
- Behavioural detection: flags loitering, tailgating, running, and crowd formation in real time.
- Object classification: distinguishes persons from vehicles from animals from debris.
- Anomaly detection: identifies events that deviate from learned baseline behaviour.
- Perimeter intelligence: triggers alerts when a virtual boundary is crossed, regardless of lighting.
- Intelligent tracking: follows an individual across multiple camera zones automatically.
- Thermal analytics: detects human presence through heat signatures in complete darkness.
- Attribute-based search: searches recorded footage by clothing colour, vehicle type, or direction of movement.
| Surveillance Approach | Human Operator Required? | PoD at 3 AM | False Positive Rate | Scene Coverage |
| Traditional CCTV (Recording Only) | Yes — full attention needed | < 10% (fatigue factor) | N/A | Limited to what operator watches |
| Motion-Triggered Alerts | Yes — for verification | 40–55% | High (15–25%) | Camera field of view |
| Rule-Based Video Analytics | Partial — alert-driven | 60–75% | Medium (8–15%) | Defined zones only |
| AI-Powered Deep Learning Analytics | Minimal — exception-based | 85–97% | Low (1–4%) | All coverage zones 24/7 |
AI analytics fundamentally changes the PoD equation because it removes human attention from the critical path. A well-configured AI analytics engine watches all cameras simultaneously, never blinks and doesn’t slow down at 3 AM.
Edge-Based Surveillance Intelligence
Modern industrial deployments increasingly use edge-based analytics where the AI processing occurs inside the camera itself, rather than on a central server. This approach offers:
- Faster alert response (sub-2-second detection to alert).
- Reduced bandwidth load on the network infrastructure.
- Continued operation during network interruptions.
- Lower cost of deployment for remote or distributed sites.
Smart cameras from leading manufacturers distributed by Impact by Honeywell in India incorporate onboard AI chips that run deep learning models locally, making them far more reliable than traditional IP cameras connected to centralised analytics servers.
| SECTION 7: Smart Perimeter & Thermal Surveillance |
Smart Perimeter Protection and Thermal Cameras in Indian Industrial Security
Perimeter security presents the highest-stakes detection challenge in industrial environments. An intrusion at the perimeter is the earliest point at which a threat can be intercepted, but it is also the most difficult zone to monitor effectively due to:
- Large distances require a long-range detection capability.
- Adverse weather: fog, rain, and dust are common across Indian industrial regions.
- Wildlife and vegetation movement generate constant false triggers.
- Complete darkness during night hours.
Thermal Cameras: Redefining Perimeter PoD
Thermal cameras detect infrared radiation emitted by all warm objects, including humans. Unlike optical cameras, thermal cameras are not affected by:
- In complete darkness, they see by heat, not light.
- A person in dark clothing is clearly visible by body heat.
- Glare and lens flare from headlights or sunlight.
- Fog and light rain defeat the optical camera contrast.
For Indian perimeter security, a layered approach combining thermal detection cameras at long range with high-resolution optical cameras for recognition at access points delivers the optimal PoD profile. This is the configuration that security engineers working with Impact by Honeywell CCTV distributor in India design for critical infrastructure projects.
| Thermal + Optical Integration: Deploy thermal cameras for long-range detection (50–200 metres) triggered alerting. Use high-resolution PTZ optical cameras for recognition-level confirmation of detected targets. This combination achieves perimeter PoD above 92% in independent assessments. |
| SECTION 8: Best Practices for CCTV Design Engineers |
Best Practices for CCTV Design Engineers
Designing a high-PoD surveillance system requires systematic engineering discipline. The following best practices apply to industrial, commercial and infrastructure surveillance deployments across India.
Step 1: Define the Detection Objective Before Specifying Equipment
Every camera position must have a defined purpose linked to a specific threat scenario. Ask:
- What incident type are we detecting: intrusion, theft, fire, unsafe behaviour?
- What is the acceptable PoD threshold for this zone 70%, 85%, 95%?
- What actions trigger when detection occurs: automated alert, operator review and access control integration?
Step 2: Conduct a Scene-by-Scene DORI Analysis
For every camera position, calculate the required pixel density at the critical detection point. Document the result. If the required PPM exceeds what the specified camera delivers at that distance, either change the camera or move the mounting position closer.
Step 3: Map Blind Spots Explicitly
Create a physical or digital map of all blind spots in the proposed design. Accept them only if:
- Compensating controls exist (access control, security officers, motion-triggered lighting).
- The risk level in that zone is documented and accepted by the client.
Step 4: Design for Lighting, Not Against It
- Specify camera sensitivity (minimum illumination) matched to the worst-case lighting at each position.
- For critical zones, specify auxiliary IR or white light illuminators.
- For perimeter and outdoor areas, use thermal cameras for detection and optical cameras for recognition.
- Test the system in the actual lighting conditions, not just daytime commissioning.
Step 5: Integrate AI Analytics from the Design Stage
Do not treat video analytics as an add-on. If AI-based detection is required (and it should be for any high-security application), the camera specifications must match the analytics engine’s requirements for resolution, frame rate, and field of view geometry.
Step 6: Plan for Operator Human Factors
- No operator should monitor more than 16 screens simultaneously for effective detection.
- Alert-driven monitoring (where AI surfaces events for operator confirmation) dramatically improves PoD.
- Remote monitoring centres with dedicated operator workstations improve response time for distributed sites.
- Regular attention and fatigue assessments for security operators improve real-world detection outcomes.
| Common CCTV Design Mistake | Impact on PoD | Correct Approach |
| Installing cameras for coverage, not detection objectives | PoD drops 30–50% | Define threat scenarios first; design cameras around detection needs |
| Ignoring DORI standards — using camera megapixels as the only spec | Images are unusable for identification | Calculate PPM at the critical detection distance for every camera |
| Mounting cameras too high for wide coverage | Pixel density at person level below Detection threshold | Mount at appropriate height for target zone; use multiple cameras |
| No AI analytics — recording only | PoD near 0% at night without operators | Integrate AI analytics from day one of the design |
| Insufficient lighting specification | Night-time PoD collapses to near zero | Specify illumination, use thermal for detection zones |
| Overlooking blind spots behind columns/equipment | Creates predictable evasion routes | 3D modelling of camera fields of view before installation |
| Commissioning in daylight only | Night performance unknown | Night-time acceptance testing is mandatory |
| SECTION 9: Industrial vs Commercial Surveillance Strategies |
Industrial vs Commercial Surveillance: Different PoD Requirements
The PoD thresholds and system architectures that apply to commercial environments, such as offices, retail stores, and hotels, differ fundamentally from industrial environments. Security engineers and procurement teams must understand these differences before specifying systems.
| Factor | Commercial Surveillance | Industrial Surveillance |
| Primary Threat | Theft, trespass, violence | Intrusion, theft, safety violations, sabotage |
| Environment | Controlled, consistent lighting | Harsh, variable, chemically active |
| Scene Complexity | Low to medium | High — machinery, vehicles, crowds |
| Required PoD Level | 70–80% typical | 85–97% for critical zones |
| Camera Types | Dome, box, PTZ | Explosion-proof, thermal, PTZ with AI, ruggedised |
| Analytics Need | Basic motion detection adequate | AI behavioural and perimeter analytics essential |
| Regulatory Compliance | Basic data protection | Industrial safety (OISD, IS codes), data protection |
| Lighting Design | Standard indoor lighting sufficient | Dedicated IR/white-light illumination designed per zone |
Design for Detection, Not Just Coverage
The most dangerous belief in security technology is that coverage equals protection. It doesn’t. A camera sees everything in its field of view and detects almost nothing without the right design, the right pixel density at the right distance, the right lighting, the right analytics and the right operational framework around it.
Probability of Detection is the engineering metric that separates a security system from a recording system. It is the difference between a facility that prevents incidents and a facility that documents them.
For Indian security professionals, system integrators, consultants, industrial project managers, and enterprise buyers, the shift from coverage-focused thinking to PoD-focused engineering is the most impactful upgrade available, often without significant additional investment.
Calculate your detection objectives. Apply DORI standards. Map your blind spots. Deploy AI analytics. Test at night. And work with partners who understand the difference between pointing cameras at your facility and designing a surveillance system that genuinely protects it.
Read Also: Dependency Between Cameras, NVRs, and Network Switches
Read Also: Network Packet Loss in CCTV Systems: Impact on Video Reliability & How to Fix It